A website analytics report can spit out a lot of hard data which, without contextualization, can be overwhelming. Most people tend to default to the basic numbers – visits, page views, and time spent on page. And, while these are the core elements of your webpage activity, they won’t tell the full story. You could be missing key prospect opportunities by not putting these elements into a context relevant to your business. 
Are you getting 50 web visits daily and worried because it’s below what you expected? Visits need a narrative before you start comparing them to your own predictions and ‘industry standards. As you follow your web visits and put them into context, you’ll start to see them change and evolve into an actionable narrative. Knowing how to contextualize web data like this will give you the ability to grow your outreach while optimizing where you place your sales energy.
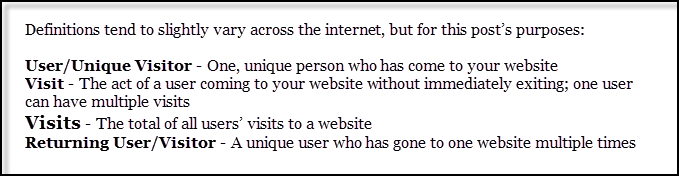
A good place to start with understanding your website activity is to take those visits and see how many are returning users. This is especially important for MSPs who want to create a potential client relationship while maintaining the interest of their current clients. Finding that user with multiple visits to your website is key. Just like going to a conference, the person that comes back to your booth later in the day is the one most interested and likely to convert to a sale.
Another good piece to the story is to find out where that returning user came from. Did multiple returning users come to the website from the same source? Is it a place you can leverage within your outreach efforts? In paid advertising, you’d look for the ad channels that are giving you a lot of returning users. For conferences, you can look for users coming from lead gen forms you’ve already set-up on landing pages just for the conference attendees that come to your booth. These are the users that are starting to become quality leads, and they’ll clue you into how best to focus your outreach efforts. If you’re at a conference and you have 50 returning users from that lead gen form, but 5 that came from pamphlets, you’ll want to order fewer pamphlets and ramp up your landing page experience.
Finally, after figuring out who is visiting your website multiple times and where they’re coming from, find out where they’re going (Behavior) and what actions they’re taking (Engagement). Important data to tie to returning visitors is the webpages they’re looking at with the most frequency. If they’re going to your blog, make sure you’re posting 3-4 times a week so they see new content. Mindmatrix can set up a blog drip for you. If they’re visiting your blog often, they’re likely to see you as an authority on the subject and want to contact you more than someone who is on their first homepage view. So a good move for you, as the website owner, is to move or replicate your contact form in the sidebar of your blog. The same can be done with e-guides or white papers. You can track the success of this move by comparing how many more form fills, clicks or downloads (Engagements) this new placement gets than its original home.
Now, you’ve formed a more well-rounded story. You can start to form action items for yourself and optimize the time you spend on attracting new clients. Once you’ve mastered navigating the core elements of your website activity you can explore adding in more story elements such as time spent on page, technology, geographic location, frequency, and recency. These are all a little more advanced and may take formal outside lessons to learn. Of course, a good website strategy relies on more than the above – it interweaves user interface (UI) and user experience (UX). But, those are conversations for another time and talk with your web development team.